

An original TeaLamp explainer based on the sources listed below. Prepared by the TeaLamp Editorial Team with the help of AI.
Every two years, a single number about wildlife decline travels around the world: 73%. It comes from the Living Planet Index, published this month in its 2026 edition, and it reads like a simple verdict on the state of nature. But the number is more subtle than most headlines suggest, and understanding what it really measures makes the story both clearer and, in some places, more hopeful.
Key takeaways on wildlife decline
- The 2026 Living Planet Index reports an average 73% decline in monitored wildlife populations since 1970. It does not mean we have lost 73% of wild animals.
- The figure is an average of population changes across 35,803 populations of 5,790 vertebrate species, combined with a geometric mean and weighted by region and species group.
- About half of the studied populations declined, while the other half stayed stable or grew.
- Freshwater wildlife fell hardest, down 85%, with the steepest regional drops in Latin America and the Caribbean (95%) and Africa (80%).
- Conservation is working where it is tried: wild tigers, bluefin tuna and the green sea turtle are all recovering.
A headline that keeps getting mangled
The Living Planet Index is published every two years by WWF and the Zoological Society of London, and every two years it makes headlines. As the Our World in Data team notes, the coverage almost always gets the number wrong: some reports call it the number of animals lost, others the share of species in decline, and a few even present it as extinctions. It is none of those things. The index tracks changes in the sizes of animal populations that scientists have monitored over time, and reports the average change. That distinction matters, because it changes what the number is telling us to do.
What the index actually measures
The 2026 edition draws on the largest dataset the project has ever assembled: 35,803 populations of 5,790 species of amphibians, birds, fishes, mammals and reptiles, tracked from 1970 to 2022. For each population, researchers measure how its size changed. Those thousands of changes are then averaged into a single index, using a geometric mean, with different weights given to different populations and species groups so that well-studied regions do not drown out the rest.
The headline result: the average monitored population is 73% smaller than it was in 1970. But look beneath the headline and the picture splits in two. Roughly half of the studied populations declined, while the other half either increased in abundance or remained stable. The index is not a census of the wild; it is a weighted average, and a few populations in steep decline can pull the whole number down.
Why the trend lines moved
Something curious happened across the last three editions. The 2022 index reported an average decline of 69% since 1970; the 2024 edition reported 73%; and the new 2026 edition reports 73% again. It is tempting to read that as four lost percentage points followed by two stable years. But almost none of the change happened in the last few years. Instead, the dataset itself grew: since the last report, the number of populations in the index rose by around 1,000 and the number of species by about 300, with a deliberate push to cover Africa, where populations included rose 14% and species 38%. The whole trend line shifted because the sample changed, not because wildlife suddenly stabilised.
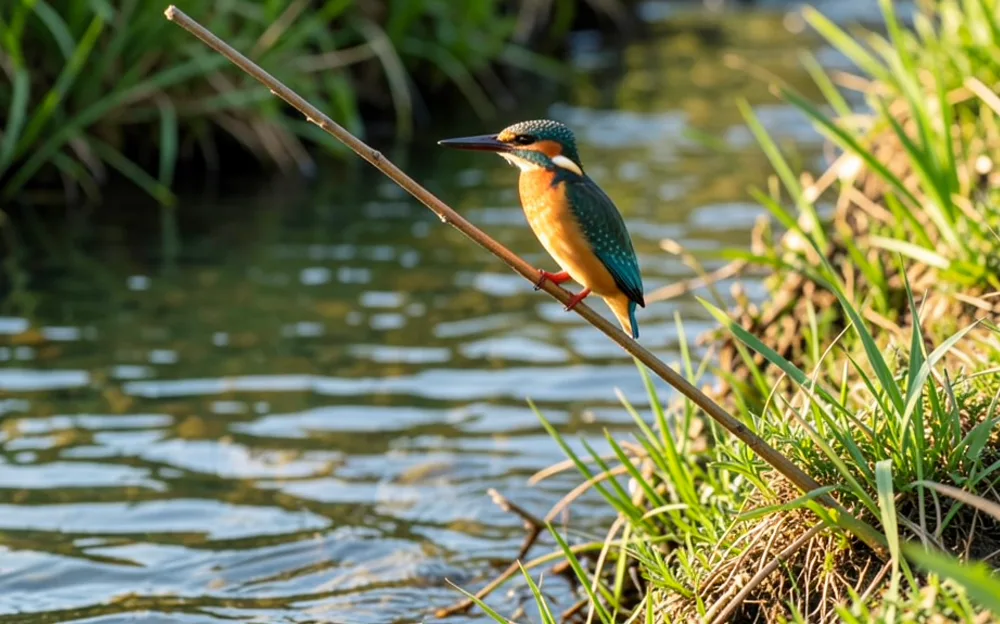
Freshwater wildlife has declined 85% on average, the steepest drop of any system. Image generated by AI.
The worst-hit corners
The global average hides deep regional and habitat differences. Freshwater wildlife, the fishes, birds, mammals, amphibians and reptiles of rivers and lakes, declined by 85%, the steepest drop of any system. Latin America and the Caribbean lost 95% on average, and Africa 80%. The main drivers are familiar: habitat degradation and loss, exploitation, invasive species, pollution, climate change and disease. Human pressure drives the declines, but the report stresses the other side of that coin: human action can also restore nature.
What we are not counting
There is a quieter caveat behind the 73% figure. A recent analysis by researchers Hannah Sarah Wauchope, Gary David Powney and Nick Isaac points out that the data behind the headline, among the most comprehensive available, are still far from complete. Counting wildlife is slow, expensive work that cannot be done from space, and systematic monitoring is patchy. Relative to what exists, far more wildlife populations are not being counted at all, and we cannot travel back in time to fill the historical gaps. The index must rely on whatever data are available: ad hoc academic studies, patchy monitoring programmes and harvest records. The 73% is the best estimate we have, but it is built on an incomplete picture of the wild.
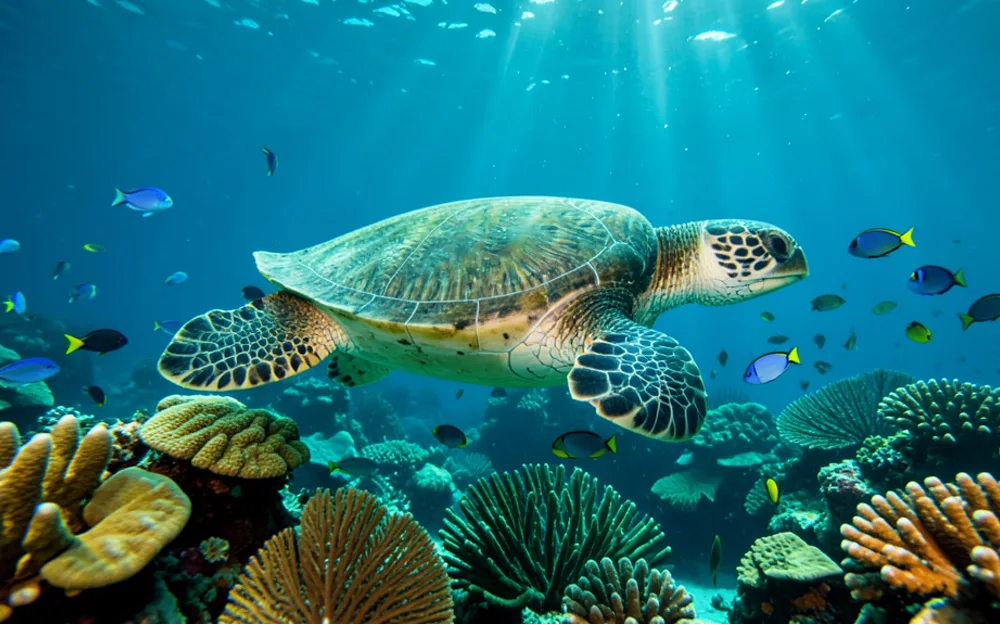
The green sea turtle was moved from Endangered to Least Concern in 2025 after fifty years of conservation work. Image generated by AI.
Why it matters
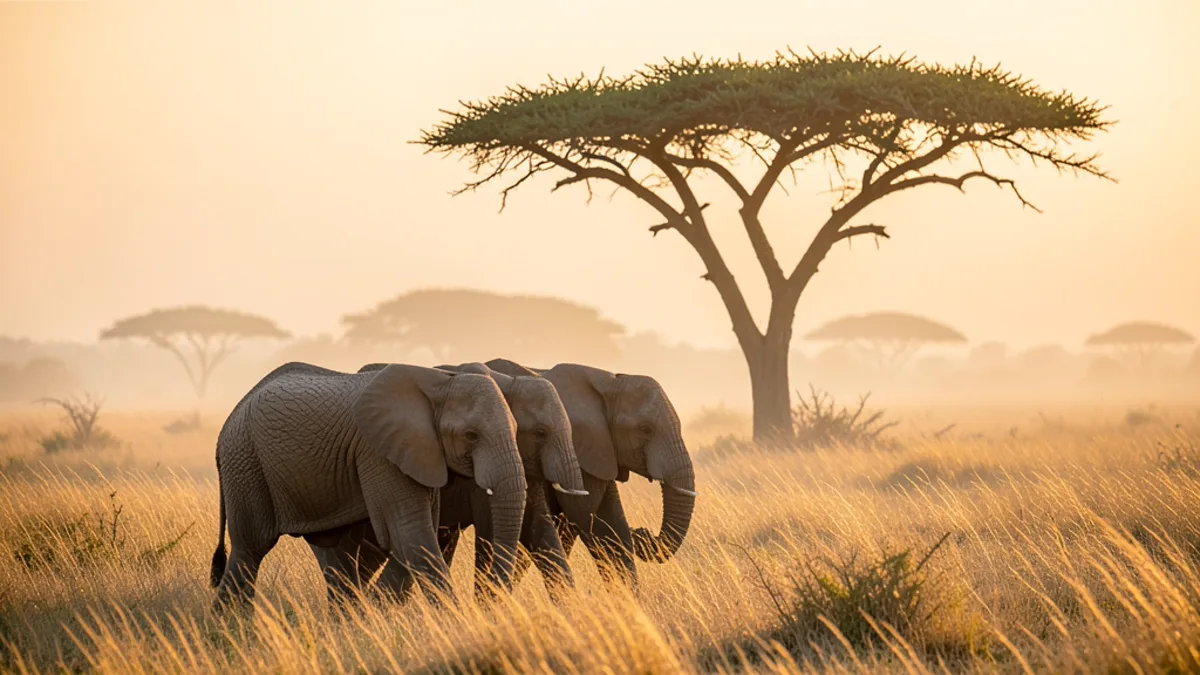
Statistics like this one shape how the world talks about nature, and sloppy versions of it shape it badly. “We have lost 73% of wildlife” sounds like a finished story, a reason to give up. The real number is a working tool: it tells conservationists which populations are falling fastest so they can aim their efforts where they are needed most. And where those efforts have been aimed, they have worked. Wild tigers have grown from around 3,200 in 2010 to roughly 5,700 in 2025, an increase of more than 70%. Atlantic and Pacific bluefin tuna, once collapsing from overfishing, have recovered to the point where neither is considered threatened. Southern African elephants are stable or growing in many places where local communities lead the management of the land. And in 2025, the green sea turtle became the first marine turtle ever moved from Endangered to Least Concern, after fifty years of work across more than eighty nesting countries. Since 1993, conservation efforts are estimated to have saved 32 bird species and 16 mammal species from extinction outright. The number is a warning, but it is also a map.
Related reading
For what ocean conservation actually looks like in practice, see Saving the Seas: What Works (and Why it Matters).
Frequently asked questions
Does the 73% figure mean we have lost 73% of wild animals?
No. It means the average monitored population is 73% smaller than in 1970. It is an average of population changes, not a count of animals lost, and about half of the studied populations actually stayed stable or grew.
Which wildlife is doing worst?
Freshwater species have declined most, down 85% on average. Regionally, Latin America and the Caribbean show a 95% average decline and Africa 80%, driven by habitat loss, exploitation, invasive species, pollution, climate change and disease.
Are any species recovering?
Yes. Wild tigers are up more than 70% since 2010, bluefin tuna have recovered from overfishing, Southern African elephants are stable or growing under community-led management, and the green sea turtle was downlisted from Endangered to Least Concern in 2025.
Sources
- Our World in Data, “The new Living Planet Index reports a 73% average decline in studied wildlife populations” (October 8, 2026)
- Zoological Society of London, Living Planet Index project page, “Key findings in the Living Planet Report 2026” (2026)
- Zoological Society of London, “Living Planet Index shines spotlight on reasons for hope” (October 7, 2026)
- Phys.org, “Wildlife populations have declined 73% since 1970 — but many of the world’s animals still aren’t being counted” by Hannah Sarah Wauchope, Gary David Powney and Nick Isaac (October 11, 2026)







0 Comments