


A TeaLamp original. Written in our own words from public-domain US government data: the Bureau of Labor Statistics Business Employment Dynamics survival tables, the SBA Office of Advocacy’s 2026 small business FAQ and the Census Bureau’s Business Formation Statistics. These agencies do not endorse TeaLamp. Prepared by the TeaLamp Editorial Team with the help of AI.
You may have heard that most new businesses fail within a year. The real numbers are gentler, and more interesting. Official US data on business survival rates, tracked for more than three decades, show that about four in five new business locations make it through their first year and roughly half are still open after five. Here is what the figures say, where they come from and what they cannot tell you.
Key takeaways on business survival rates
- Year one: about 80% of new US business establishments survive their first year. The newest class measured, opened in the year to March 2024, came in at 77.9%.
- Year five: on average about half (49.2%) are still operating, based on classes from 1994 to 2022.
- The long run: about a third (33.9%) reach ten years and a quarter (25.5%) reach fifteen.
- Age helps: of businesses that reach five years, 69.5% go on to reach ten.
- Survivors grow: the class of 1994 opened with an average of 7.2 employees per location; its survivors averaged 26.9 by 2025.
Where the numbers come from
The US Bureau of Labor Statistics (BLS) runs a programme called Business Employment Dynamics. It follows private-sector establishments with paid employees, using the records employers file for unemployment insurance. Each year it groups new establishments into a class and tracks how many are still around in every following year.
Two details matter. First, an establishment is a single place of business, such as one shop, office or workshop, not a whole company. Second, the data only cover places with employees. Most small businesses in the United States have none: of about 36.2 million small businesses, 82.3% are nonemployer firms, according to the SBA Office of Advocacy. So these rates describe businesses that have grown big enough to hire.
The first year is the steepest step
Take the class of businesses that opened in the year to March 2015: 677,876 new establishments. A year later, 79.6% were still operating. After two years, 69.1% remained, and after five years, 50.2%.
What stands out is how steady that first-year figure is. Across classes from 1994 onward, first-year survival has stayed between about 75% and 81%. The low point, 75.2%, belongs to businesses that opened in the year to March 2008 and met the financial crisis in their first year. The high point, 80.9%, belongs to the class of 2020, which opened just before the pandemic took hold.

Keeping careful books helps a young business through its first year. Image generated by AI.
After year one, the odds get better
The BLS tables also show what share of the previous year’s survivors make it through another year. For the 2015 class, that figure climbed from 79.6% in year one to 86.8% in year two, 88.9% in year three and more than 90% from year five on. For older classes, it settles at about 95% to 96% a year after a decade.
The SBA’s 2026 summary puts it another way: 69.5% of establishments that survive five years also reach ten, and 76.1% of those that reach ten go on to fifteen. In plain terms, every year a business survives makes the next year a little more likely.
The long view: the class of 1994
The oldest class in the data opened 569,387 establishments in the year to March 1994. By March 2025, 71,595 were still operating, or 12.6%. That sounds small, but look at the jobs. When they opened, the whole class employed about 4.13 million people. By 2025 the survivors alone employed about 1.93 million, close to half the original total, at an average of 26.9 workers each.
That average reflects both growth at the survivors and the fact that the group has changed as others closed. Either way, the businesses that last tend to become important employers. The SBA reports that small businesses created 61% of net new jobs in the US since 1995.
Hard times leave a mark
Timing matters. The class that opened in the year to March 2007, whose early years ran into the Great Recession, had 46.4% of its establishments left after five years. The class of 2015, which grew up in calmer conditions, had 50.2%. Surprisingly, the classes of 2019 and 2020, which met the pandemic early on, did slightly better at five years, at 51.5% and 51.4%.
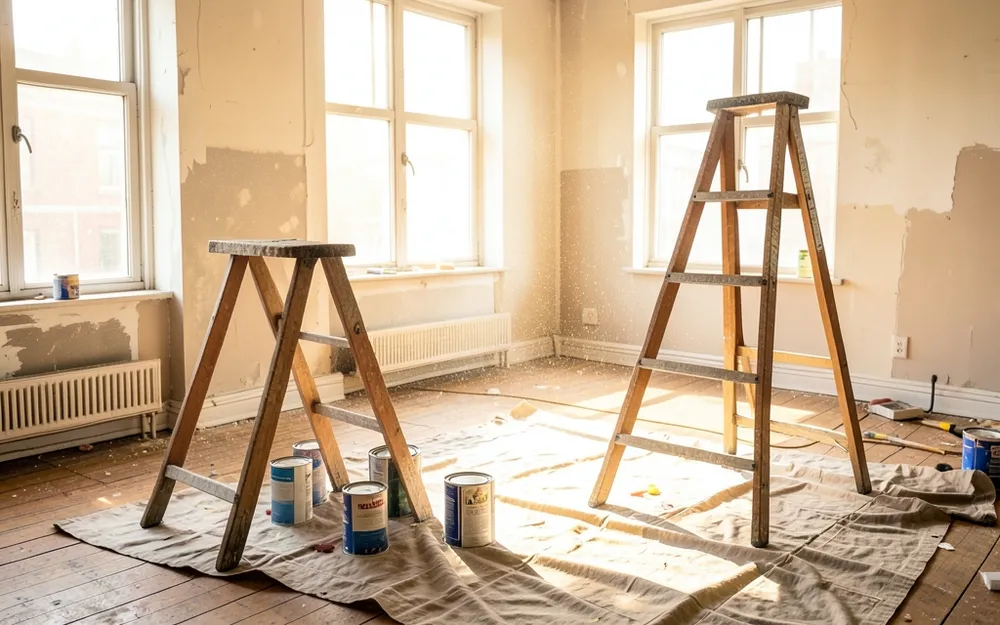
When one shop closes, the space often welcomes another. Image generated by AI.
A boom in new businesses
Americans are starting businesses at a high pace. Census Bureau data show about 5.6 million business applications in 2025 on a seasonally adjusted basis, more than in the earlier peak years of 2021 and 2023. Not every application becomes a business with staff, but the BLS tables show the effect too: the class that opened in the year to March 2022 was the largest in the series, at 1,065,228 establishments, against about 770,000 in 2019.
The SBA adds that startups made up 14.2% of business establishments in 2023, up from 12.5% in 2019. More starts mean more competition, but also more chances for good ideas to take root.
What the numbers cannot tell you
- Closing is not always failing. Owners retire, sell, change direction or close a project that met its goal.
- Averages hide differences. Survival varies by industry and by state; BLS publishes separate tables for both.
- Self-employed people without staff are not counted. That is most small businesses.
- These are US figures. Other countries measure survival differently and get different results.
Why it matters
The myth that nearly every new business collapses in its first year can scare people away from good ideas. The real picture is more encouraging: the first year is the hardest, about half of new employers last five years, and each year survived improves the odds for the next. For anyone sketching a bakery or repair shop on a napkin over a cup of tea, that is useful to know. Plan for a tough first stretch, and expect the road to get a little smoother with time.
Frequently asked questions
What share of new businesses fail in the first year?
About one in five US business establishments with employees closes within its first year. First-year survival for recent classes has ranged from 77.9% to 80.9%.
How many businesses survive five years?
About half. For classes opened between 1994 and 2022, the average five-year survival rate was 49.2%, according to the SBA.
Does survival get easier over time?
Yes. After about ten years, roughly 95% of the previous year’s survivors make it through each additional year.
Related reading
For a very different test of business resilience, read how Ukrainian small businesses have survived five years of war.
Sources
- US Bureau of Labor Statistics, Business Employment Dynamics, Table 7: Survival of private sector establishments by opening year (public domain).
- US Bureau of Labor Statistics, Establishment age and survival data.
- US Small Business Administration Office of Advocacy, Frequently Asked Questions About Small Business, 2026 (public domain).
- US Census Bureau, Business Formation Statistics, via FRED, Federal Reserve Bank of St. Louis.








0 Comments