

Originally published by Aruneem Mazumder and Rishikesh Sinha in LSE Business Review on October 16, 2026, under a Creative Commons Attribution 4.0 licence. Adapted here under that licence: rewritten and restructured for a general audience, with new headings, key takeaways and a FAQ; the original’s Shutterstock image was not reused. LSE Business Review and the authors do not endorse TeaLamp. Prepared by the TeaLamp Editorial Team with the help of AI.
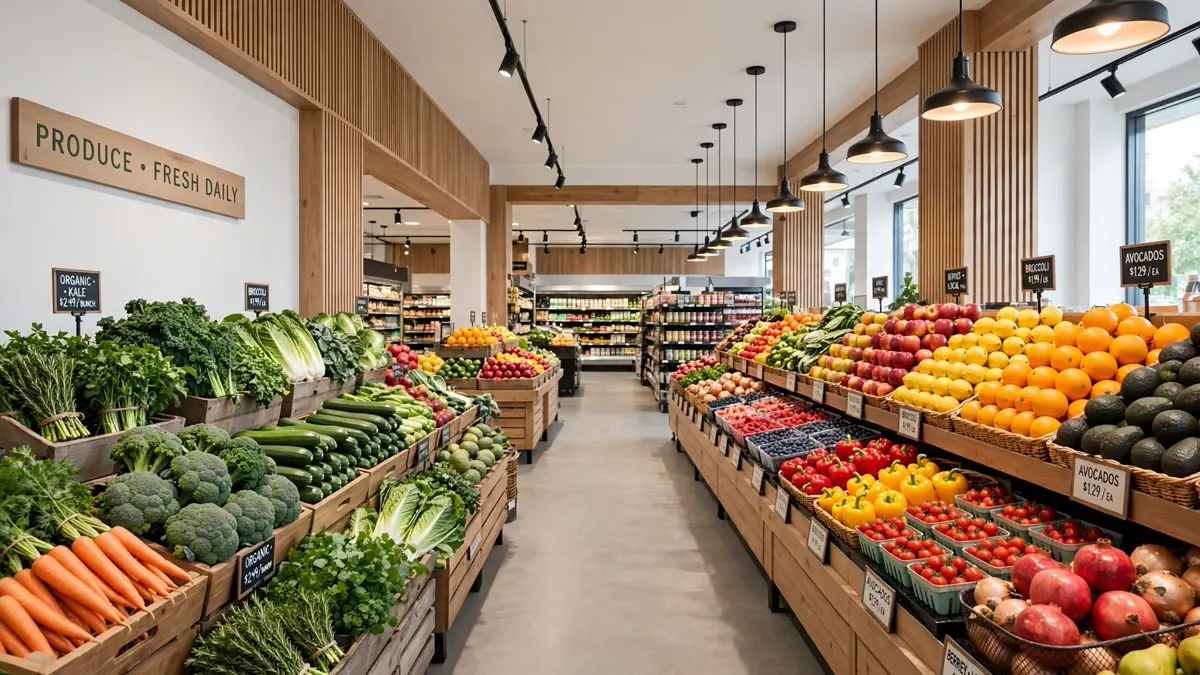
Picture a supermarket’s annual carbon footprint as a pie chart. The slice for its shops, lorries and fridges is a sliver. Everything else — the fertiliser, the factories, the shipping behind every product on the shelves — is the pie. In reporting jargon, that giant remainder is scope 3 emissions, and for Britain’s biggest grocer it runs to about 99 percent of the total. A recent analysis asks an uncomfortable question about that pie: how much of it was weighed, and how much was guessed?
Key takeaways on scope 3 emissions
- Scope 3 covers a company’s value chain — for supermarkets, nearly the entire carbon footprint.
- At Tesco, only around 9 percent of the purchased-goods slice is built on data from suppliers themselves; most of the rest is modelled from how much money was spent.
- Spend-based maths has quirks: squeezing a supplier on price can shrink the reported footprint without cutting a single tonne of carbon.
- Britain’s new SRS S2 standard and the FCA’s incoming disclosure rules (first reports 2028) still do not require firms to reveal the measured-versus-modelled split.
- Two modest remedies are proposed: disclose the mix, and stop asking suppliers the same carbon questions five different ways.
The 99 percent you never see
Climate accountants divide emissions into three scopes. The first covers a firm’s own chimneys and tailpipes. The second covers bought-in energy. The third — Scope 3 — covers the value chain: raw materials, manufacturing, transport, and what happens after the sale. A supermarket makes almost nothing it sells, so its Scope 3 dwarfs the rest. Tesco puts its own figure near 99 percent.
That would be fine if the number were solid. Within purchased goods and services, the biggest category, Tesco says roughly 9 percent of its calculation draws on primary records — fuel logs, fertiliser data and the like, supplied by the producers. The bulk is derived from expenditure: take what was paid for a product type and multiply by an industry-average carbon intensity.
When cheaper looks greener
Modelling carbon from spending produces perverse results. Haggle a supplier down and the reported emissions drop, though the farms and factories changed nothing. Move to a truly cleaner supplier at an identical price and the ledger barely notices. A number meant to measure decarbonisation can end up measuring procurement muscle instead.
Nor do shoppers get a second opinion. The researchers compared three chains: only Tesco discloses a primary-data share. Sainsbury’s says supplier data is being folded in, but offers no figure; Lidl GB’s public reporting gives no equivalent at all. Candour, perversely, can make the transparent retailer look worse than the silent one.
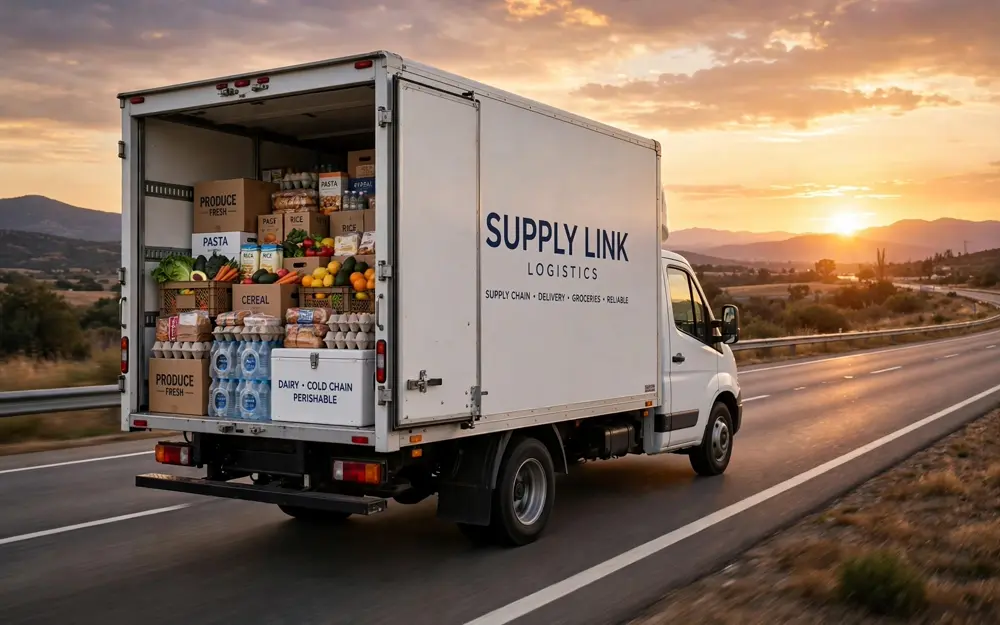
Most of a grocer’s footprint lies in its supply chain, not its stores. Image generated by AI.
The disclosure gap
Britain’s new standard for climate reporting, SRS S2, nudges firms toward measured and verified inputs — then lets them file a single blended total built partly on industry averages. Oddly, the same rulebook obliges asset managers to state a precise percentage for their financed emissions, while letting supermarkets off with a written explanation of their methods. No percentage required.
Regulators had a chance to fix this. On September 30, 2026, the Financial Conduct Authority issued final rules taking effect for accounting periods from January 2027, with first reports in 2028 and an additional year’s grace for Scope 3. The regime runs on “comply or explain” — and the explanation still does not have to include the share of the figure that was actually measured. Brussels moved the same way: the EU’s first sustainability standards demanded such a percentage, but the streamlined version adopted in July 2026, applicable from 2027, let it go. With some 40 jurisdictions copying the template, the omission is now global.
What one number hides
The authors identify three soft spots beneath any Scope 3 headline — all about disclosure, not about how much is emitted.
First, provenance: supplier records versus modelled estimates, with no duty to show the proportions. Second, freshness: Tesco’s headline blends 2025/26 figures for its own operations with predominantly 2024/25 supply-chain data, so the “annual” total spans two different years. Third, assurance: Deloitte’s independent check covered selected Tesco Scope 3 categories adding up to 15.7 million tonnes, set against a 68.1-million-tonne footprint across all scopes. Audited in part, presented as a whole.
Faced with such numbers, readers react in one of two ways, the authors observe: they either treat the estimate as exact, or they ignore it and decide on price and reliability instead. Both are reasonable — and both are what happens when data arrives without a label.
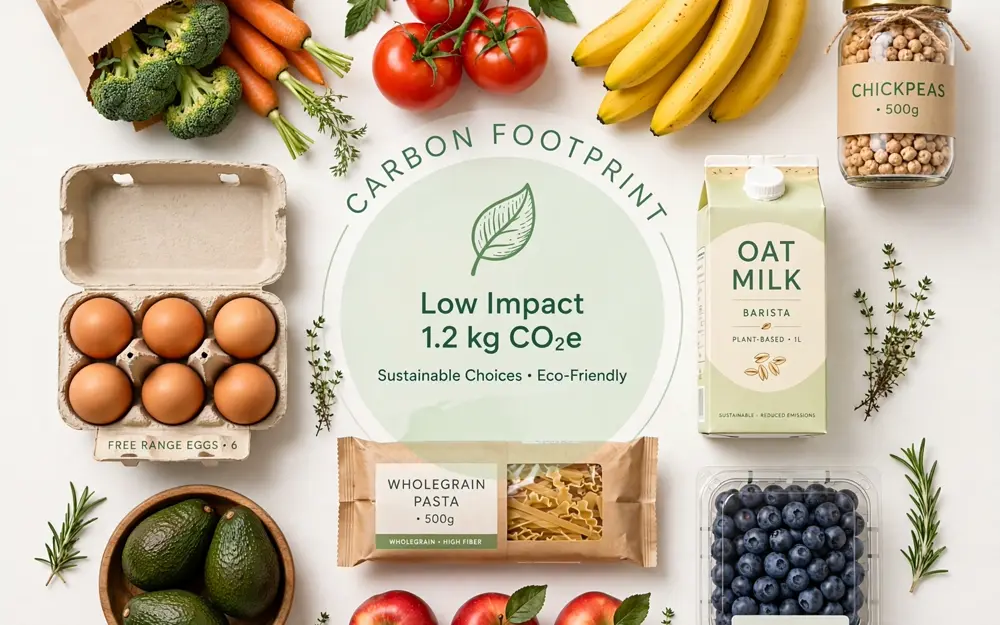
A closer look at what the headline carbon number is made of. Image generated by AI.
Ask once, show the mix
The burden currently lands on suppliers. A farm or manufacturer serving several chains can be sent a different carbon questionnaire by each customer — Sainsbury’s runs Foodsteps, Secaro and HIGG; Lidl GB uses Mondra and Manufacture 2030; Tesco has quit Secaro. Answering the same questions repeatedly costs time and money, and the EU has already given smaller suppliers a right to refuse anything beyond a defined standard. The authors want Britain to rally behind the BRC-Mondra Coalition, where retailers and suppliers are building one shared methodology, instead of inventing another competing form. Aldi, Lidl GB, Asda, Morrisons and the Co-op are not stock-market listed, so the FCA’s rules miss them entirely despite sharing the same suppliers — a gap the government’s corporate-reporting review should address.
The companion proposal is even simpler: publish the mix. For purchased goods and services, state the share of the total grounded in supplier data and describe the methods behind the remainder. Investors could finally compare two retailers; suppliers would see where evidence is truly missing. The GHG Protocol has requested a per-category version of this figure since 2011. As the authors conclude: “Numerical precision should no longer be mistaken for measurement quality.”
Why it matters
None of this will ever appear on a price ticket. These are company-level totals for annual reports, not per-product footprints, and Britain’s handful of eco-labels are voluntary and separately judged. What the totals support is the credibility of corporate climate pledges — pledges that the competition watchdog’s Green Claims Code insists must be backed by solid evidence. Showing where measurement stops and modelling starts would not cost much. It would simply let everyone see the number for what it is.
Related reading
Corporate pollution takes many forms: read how microplastics became a hidden chemistry problem.
Frequently asked questions
Does this mean supermarkets are greenwashing?
Not necessarily. The critique targets disclosure, not emissions: a chain with a heavily modelled footprint might be cutting carbon fast. The problem is that outsiders cannot distinguish real reductions from spreadsheet effects.
Will shoppers ever see these figures on packaging?
No. Scope 3 reporting produces company-wide annual totals for investors and regulators. Product-level footprints would need an entirely different, item-by-item system.
Why do private chains escape the new rules?
The FCA regime applies to listed companies. Big private grocers — Aldi, Lidl GB, Asda, Morrisons, the Co-op — fall outside it even though they share suppliers with the listed chains, which is why the authors call for the wider reporting review to close the hole.










0 Comments