

An original TeaLamp explainer based on the sources listed below. Prepared by the TeaLamp Editorial Team with the help of AI.
When you hear that global poverty is falling, the first question should be: falling below what line? A new look at the world’s income data gives a reassuring answer. No matter which poverty line you choose, the share of people living below it has fallen since the year 2000. That is the headline from Our World in Data’s October 2026 update, built on the World Bank’s latest global poverty figures.
The update is also a warning against reading a single number too simply. The world has made real progress, and most people still live on low incomes. Both things are true at the same time.
Key takeaways on global poverty
- The share of people living on less than 3 dollars a day fell from 36 percent in 2000 to 10 percent in 2024.
- The same downward pattern holds at higher lines: below 5 dollars a day, the share fell from 57 percent to 25 percent, and below 10 dollars a day, from 74 percent to 53 percent.
- Most people still live on low incomes: 81 percent of the world lives on less than 30 dollars a day, about 900 dollars a month.
- Progress is uneven. Extreme poverty is rising in the Middle East, North Africa, Afghanistan and Pakistan region, and it remains high in Sub-Saharan Africa.
- The figures come from household surveys, adjusted for what money actually buys in each country, and the latest solid estimates run to 2024.
What global poverty lines actually measure
A poverty line is a daily income or spending level, per person, below which someone counts as poor. The World Bank’s international poverty line, the one used for extreme poverty, is set at 3 dollars a day. That figure is not 3 American dollars in cash. It is 3 international dollars, adjusted for purchasing power in 2021 prices, so that it means roughly the same standard of living in different countries. A dollar buys far more in some places than in others, and the adjustment tries to correct for that.
Higher lines work the same way, but they describe less severe poverty. The World Bank also tracks lines around 5 dollars and 10 dollars a day, and a line of 8 dollars and 30 cents a day typical for upper middle income countries. None of these lines says that life above the line is comfortable. They are markers on a long slope, not a cliff edge between poor and fine.
The headline number, and why it can mislead
The most quoted figure is the extreme poverty rate: about 1 person in 10 worldwide, or more than 824 million people, lived on less than 3 dollars a day in 2024. The World Bank updated that estimate in September 2026, and it now projects a small further fall, to 9.8 percent in 2026. Those later years are projections based on economic forecasts, not survey results, so they should be read as an expectation, not a count.
The headline can mislead in two directions. It can sound like poverty is nearly solved. It is not: 824 million people is still an enormous number, and the line itself is extremely low. Critics sometimes say progress only shows up because the line is set so low. The new chart answers that worry directly. Raise the line to 5 dollars, to 10 dollars, or higher, and the improvement is still there.
Global averages also hide where progress has stopped. Extreme poverty is now below 5 percent in every region except two: the Middle East, North Africa, Afghanistan and Pakistan region, where it is rising, and Sub-Saharan Africa, where it remains high.
What changed between 2000 and 2024
The biggest falls happened at the lowest lines, and that makes sense. In 2000, more than a third of humanity lived in extreme poverty. By 2024, that share was about a tenth. At 5 dollars a day, the share more than halved, from 57 percent to 25 percent. At 10 dollars a day, it fell from about three quarters of the world to just over half.
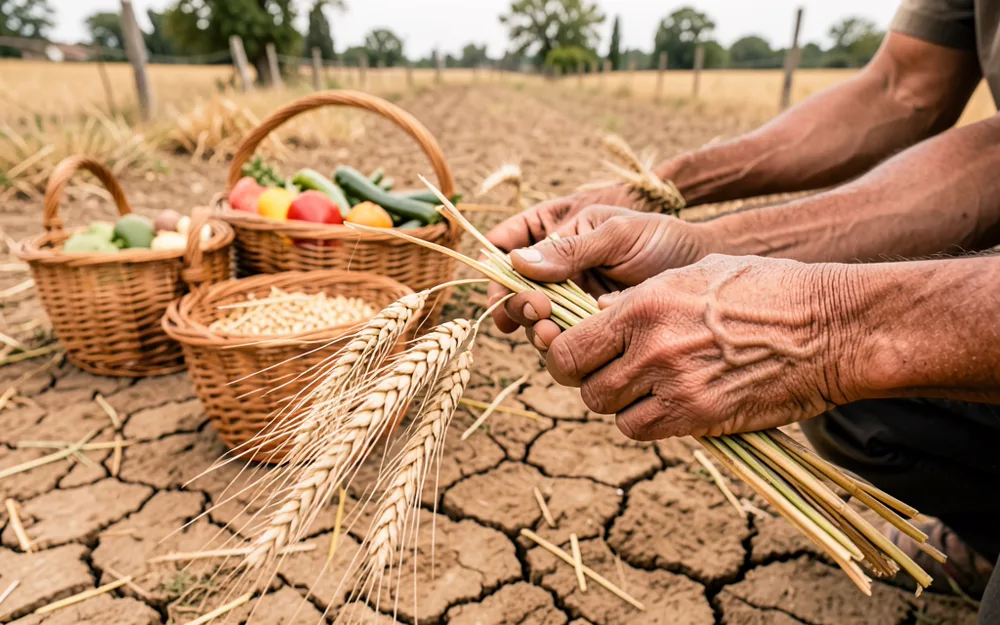
Harvest work in a farming village. Image generated by AI.
Country stories help explain the global shape. China is often held up as the classic case: in the early 1980s, over 90 percent of its population lived in extreme poverty, and by the early 2020s that figure was close to zero. Indonesia shows a similar path. In 1984, 86 percent of Indonesians lived on less than 3 dollars a day. By 2025, that had fallen to under 4 percent, and the number of Indonesians in extreme poverty had dropped from about 140 million to about 10 million.
These are not just numbers moving on a chart. They reflect decades of rising farm output, expanding cities and jobs, better schools and health care, and steadier incomes in many places. No single policy explains every country. What the data can say is that large scale poverty reduction is possible, because it has already happened in many different settings.
Why progress looks different at higher lines
If the story were only about extreme poverty, it would be easy to declare victory too early. The higher lines tell the harder half. In 2024, a quarter of the world still lived on less than 5 dollars a day, and just over half on less than 10 dollars a day. At 30 dollars a day, roughly the level of a modest income in a rich country, 81 percent of humanity still falls below the line.
That is the difference between escaping extreme poverty and reaching a secure life. A family can move from 2 dollars a day to 4 dollars a day and still be one illness, one bad harvest or one lost job away from falling back. The higher lines capture that fragility, and why progress can feel invisible in daily life even when the charts improve.
The World Bank’s upper middle income line makes the same point from another angle. At 8 dollars and 30 cents a day, the global rate fell from 48.7 percent in 2021 to 46.2 percent in 2024, and is projected to reach 44.4 percent in 2026. The direction is the same, but the pace is slower and the remaining share is much larger. The higher you set the bar, the more work is left.
How solid are these numbers
Poverty figures are estimates, not headcounts, and the September 2026 update is a good reminder of that. When new survey data for India arrived, the World Bank revised its 2024 global extreme poverty estimate down, from 10.4 percent in the March 2026 vintage to 10.1 percent, and the estimated number of people in extreme poverty from 846.8 million to 824.3 million. The revision came mainly from South Asia. It does not change the overall story, but it shows that the figures move when better surveys replace forecasts.
Coverage matters too. The 2024 estimates rest on household surveys covering enough of the world’s population to be reliable, while the 2025 and 2026 figures are nowcasts built from economic projections. Conflict and weak survey systems can leave gaps, especially where poverty is highest. Treat the latest years as the best available picture, not a photograph.
It is also worth remembering what the lines leave out. They measure income or spending, not health, schooling, safety or dignity, and they say nothing about inequality within a country. The lines are a starting point for judging progress, not the whole judgment.
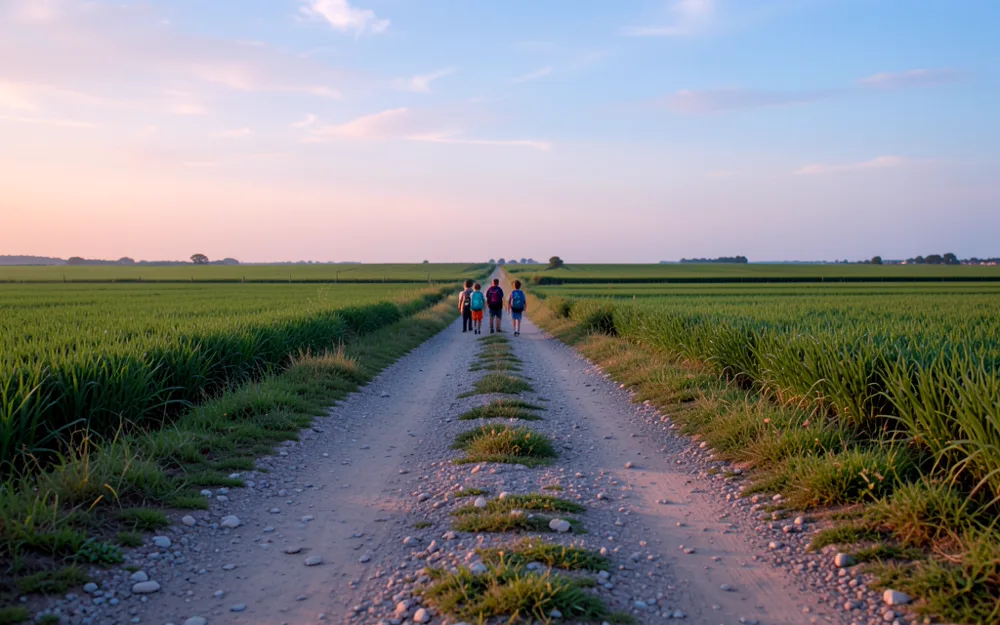
The walk to school at dawn. Image generated by AI.
Why it matters
Poverty lines shape real decisions. Governments use them to target support, aid agencies use them to judge where help is most needed, and voters use them to decide whether the world is getting better or worse. A single line can hide as much as it reveals. Looking across several lines at once gives a fairer test: is life improving only for those nearest the bottom, or across the whole income range? On the latest data, the answer is encouraging, and incomplete. The bottom has risen, and the middle is still a long way from secure.
Related reading: our explainer on another widely misunderstood global number, What the 73% Wildlife Decline Number Really Means, shows how a single headline figure can hide the real story underneath.
Frequently asked questions
What is the international poverty line? It is the World Bank’s line for extreme poverty, currently 3 dollars a person a day in 2021 purchasing power terms. It is meant to represent the same very low standard of living in every country, after adjusting for local prices.
Does falling poverty mean most people are now well off? No. Fewer people are below each level than before, but most of the world still lives on less than 30 dollars a day. Escaping extreme poverty and reaching a secure income are two different milestones.
Why do the poverty figures sometimes get revised? Because they are built from household surveys that arrive at different times for different countries. When a large country publishes a new survey, as India did for the September 2026 update, the global estimate can shift. Revisions are a sign the system is updating, not that the earlier figure was invented.
Sources
- Our World in Data, “No matter what poverty line you choose, the share of the global population below it has declined” (October 22, 2026)
- World Bank Blogs, “September 2026 Global Poverty Update from the World Bank: One in ten worldwide live in extreme poverty” (September 22, 2026)
- World Bank, Poverty and Inequality Platform September 2026 update note (global and regional estimates, 2024 vintage revisions)









0 Comments